Looking Back on our First Year of ViSciPub
It’s one year into the project and hence an appropriate time to sum things up. Of course one of the main things with such an international and remote research cooperation was setting up the necessary (digital) infrastructure, such as mailing lists, shared/cloud drives, code repositories, etc.
Arguably communication is one of the most crucial topics when engaging in a project where the partners can only meet once a year in person. To cope with the problems that might arise we institutionalized monthly jour fixe meetings. In addition to these larger meetings, a variety of bilateral meetings, specifically between PhD students, happened: over Skype with China, and at dwh and TU in person for the inner-Austrian collaboration.
After establishing the infrastructure we went on to extensive research of the state of the art and a precise specification of the research goals. With those tasks checked off we were ready to start.
First we created a basic pipeline for data scraping consisting of the following parts. The initial step of the pipeline is a web scraping script which was used to download publications and the meta information from CHI, KDD, Siggraph and Wintersim conferences. We were able to scrape a total of 6159 publications from SIGGRAPH, KDD and CHI, regarding the Wintersim we were able to scrape another 10682 pdfs (7562 of them text, not scans). For VIS (2303) and EuroVis (559) the publications and meta information were already available from the KeyVis project. These pdfs sum up to a corpus of 19703 scientific publications. The next step in the pipeline is the extraction of the full texts as well as a predefined set of metadata features like authors, affiliations, titles, DOIs, references etc. from the publications. One of the main topics here was noise from the pdf extraction as well as missing important data.
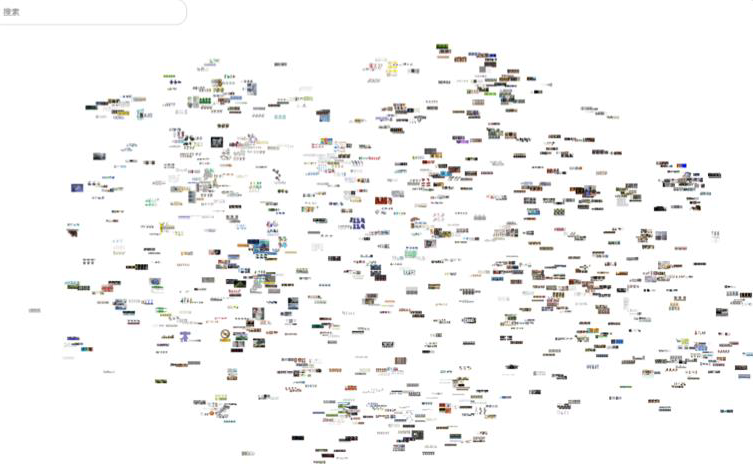
Literature browser for browsing of all SIGGRAPH papers,
represented by their teaser images. Zooming adds more
information (e.g. paper title, authors, abstract, ...).
The network layout is arranged based on keywords-
clustering of abstracts using the TF-IDF approach.
With the data collected we started the initial prototyping. We designed a system to browse all SIGGRAPH papers that are represented by their teaser images. When zooming in, more information including paper title, authors, even abstract of the papers appears. The layout of all papers is arranged based on the clustering of keywords and abstracts using the TF-IDF approach.
The scientific insight gained lead to a number of publications:
- Yunhai Wang, Zeyu Wang, Chi-Wing Fu, Hansjörg Schmauder, Oliver Deussen, Daniel Weiskopf. Image-Based Aspect Ratio Selection. IEEE Transactions on Visualization and Computer Graphics (Proc. InfoVis 2018), 2018
- Wei Zeng, Yu Ye. VitalVizor: A Visual Analytics System for Studying Urban Vitality. Volume 38: 38-53, 2018
- Wenyong Gong, Weihong Xu, Leqin Wu, Xiaohua Xie, Zhanglin Cheng. Intrinsic Image Sequence Decomposition Using Low-Rank Sparse Model. IEEE Access. Volume 7 : 4024 – 4030, 2018
- Jianwei Guo, Shibiao Xu, Dong-Ming Yan, Zhanglin Cheng, Marc Jaeger, Xiaopeng Zhang. Realistic Procedural Plant Modeling from Multiple View Images. IEEE Transactions on Visualization and Computer Graphics, 2018
To sum up, we are quite proud of the outcome of our first year of ViSciPub. And we are very much looking forward to the next two years when we will keep digging deeper into the topic.
We invite you to follow us on our research-journey. If you are interested in regular updates, or would like to participate in the research or have more information about it, drop us a note (on the very bottom of the page)!